40% Off Signals

Trading with Trendlines

technical Analysis Course
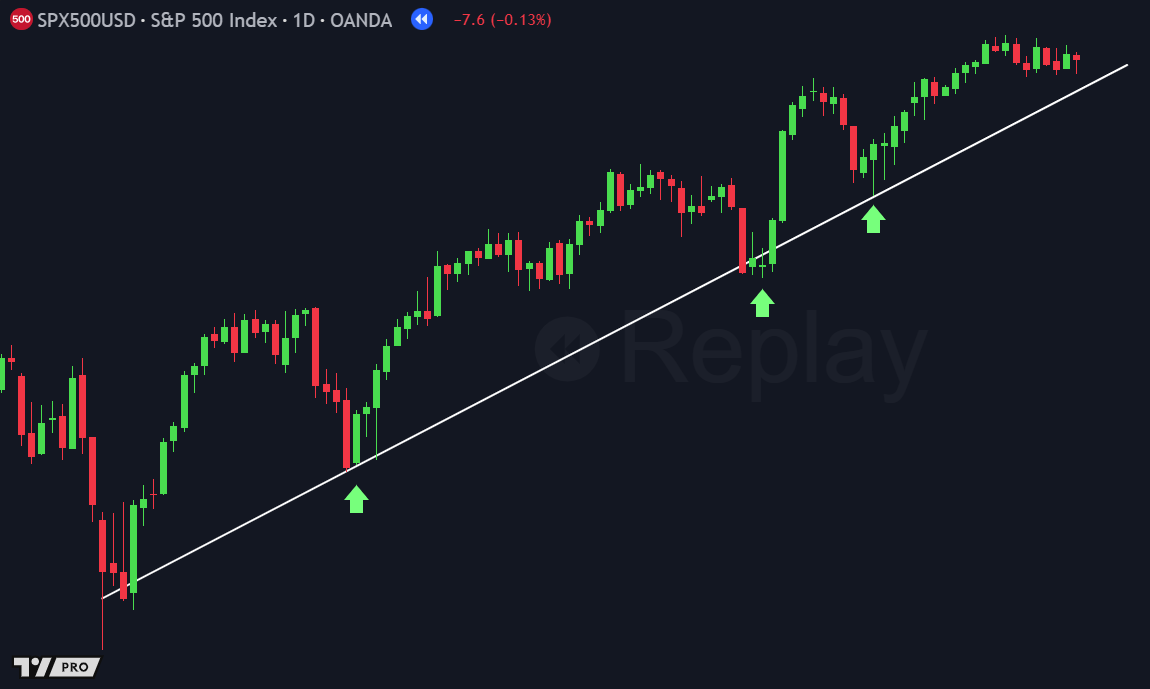
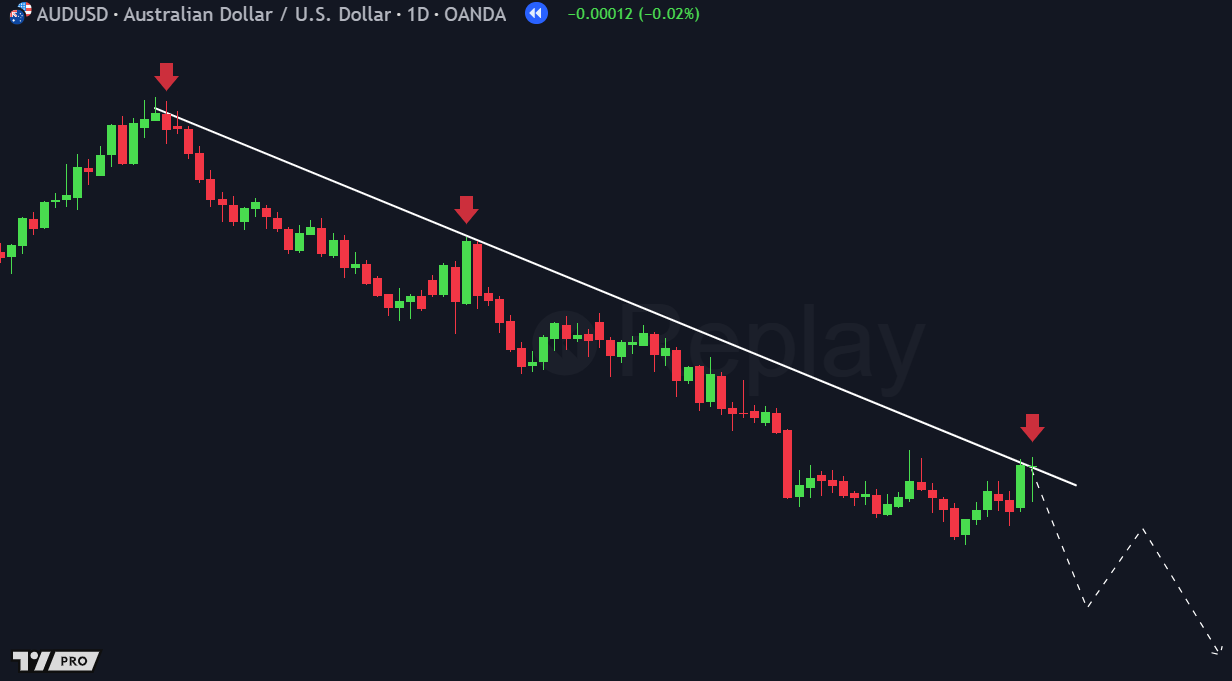
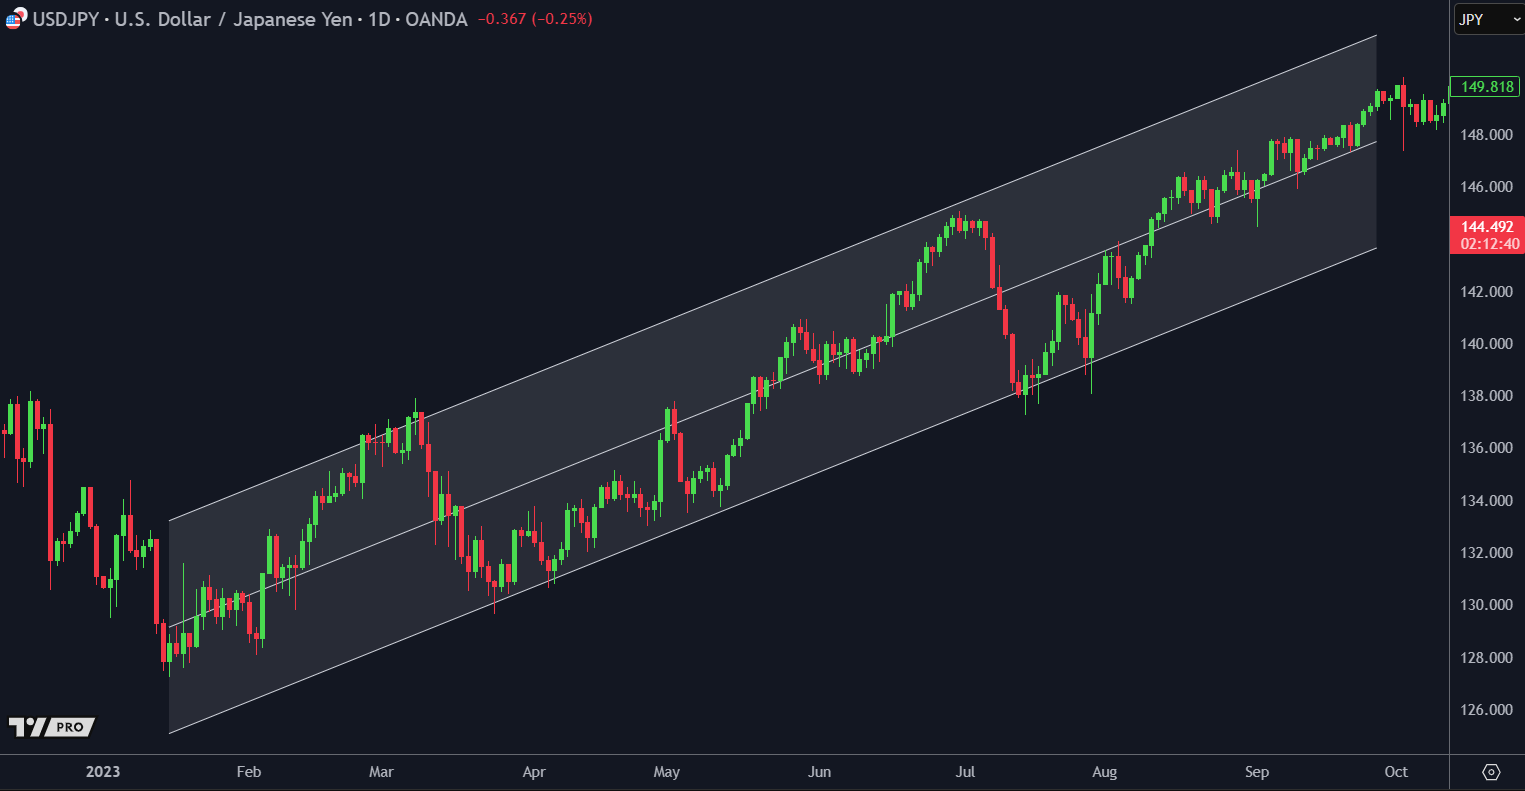
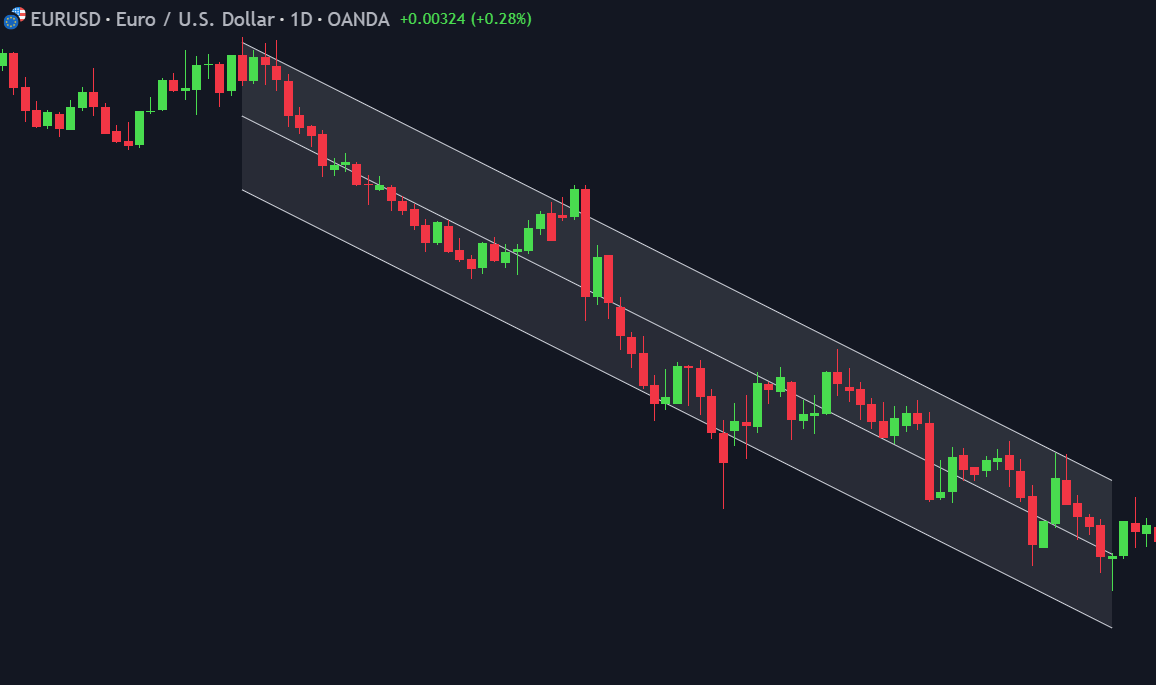
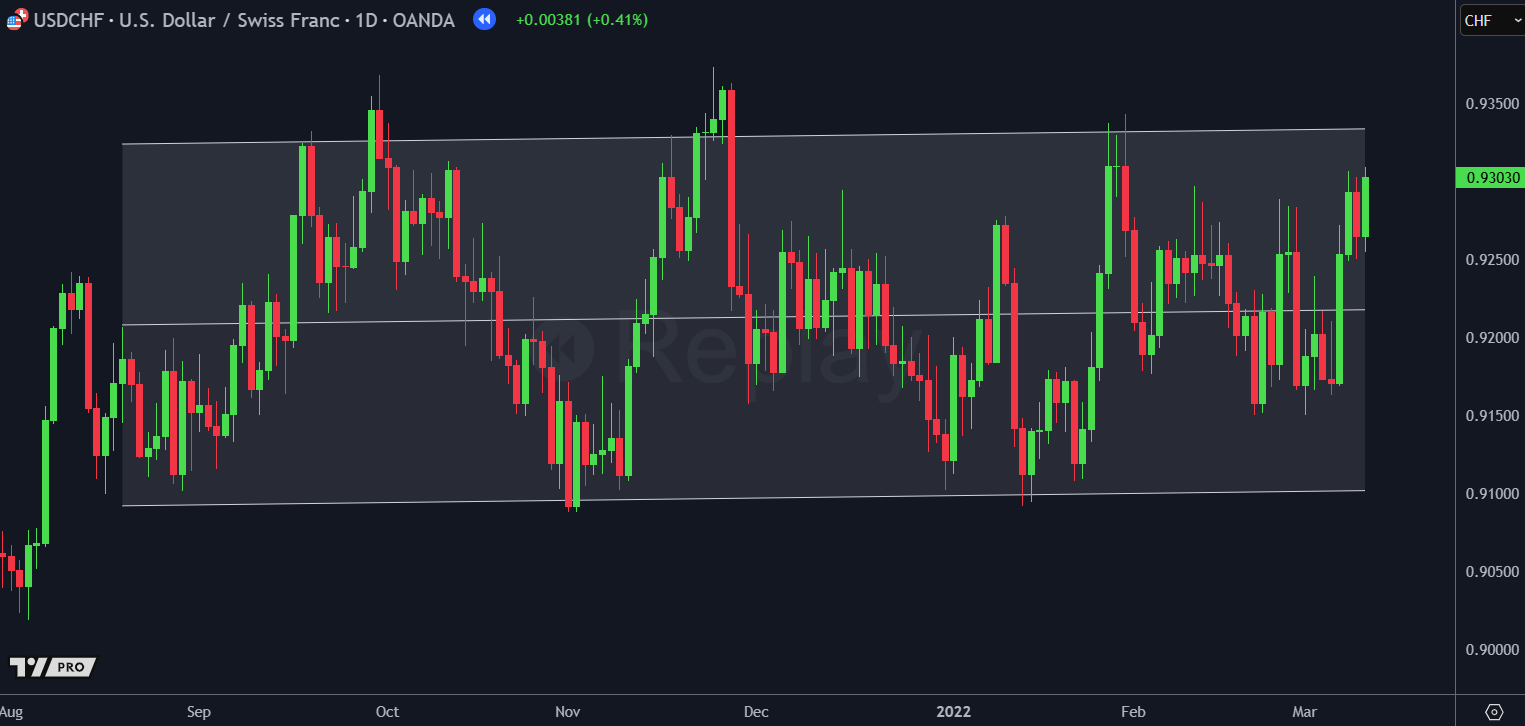
Trendlines are a widely used tool among traders to identify patterns and potential trading opportunities in the price action of various assets, such as stocks, cryptocurrencies, or forex pairs. These straight lines connect two or more price points, helping traders to visualize channels, wedges, and other formations that indicate the direction of the market. While the drawing of trendlines can be somewhat subjective, they are invaluable in providing insights into market trends and potential breakout or consolidation zones.

Understanding Trendlines

Trendlines serve as visual aids that highlight trends in price movements. By connecting significant highs or lows in the price chart, traders can discern the direction in which the market is moving. There are two primary types of trendlines:

1. Uptrend Line

An uptrend line is drawn by connecting a series of ascending lows. It indicates that the price is experiencing higher lows, suggesting a bullish market sentiment. This type of trendline is used to identify buying opportunities and gauge the strength of an upward trend.

2. downtrend Line

A downtrend line is created by linking a series of descending highs. It suggests that the price is facing lower highs, indicating bearish market sentiment. Traders often use this trendline to spot selling opportunities and monitor the persistence of a downward trend.

Drawing Trendlines

The process of drawing trendlines can vary among traders, leading to some degree of subjectivity. Here are some general steps to follow:

1. Identify Significant Points

Locate at least two significant highs or lows on the price chart. These points serve as the foundation for drawing the trendline.

2. connect the points

Draw a straight line connecting these points. Extend the line to the right to project future potential support or resistance levels. The line should ideally touch as many price points as possible.

3. Adjust for accuracy

Some traders may adjust the trendline to better fit the overall price action. This involves minor modifications to ensure the trendline accurately reflects market behavior and touches key price levels.

Subjectivity in Trendlines

Due to the subjective nature of drawing trendlines, different traders might have slightly different interpretations of the same price chart. This discrepancy can lead to varied opinions on potential breakout or consolidation zones. Despite this subjectivity, trendlines remain a useful tool for identifying general areas where traders might consider entering or exiting trades.

Using trendlines to trade

Trendlines are particularly useful for identifying trading opportunities based on the overall trend. Traders look for areas where the price interacts with the trendline to make trading decisions. Here’s how to use trendlines effectively:

Buying in an uptrend

In an uptrend, traders look for opportunities to buy when the price approaches the uptrend line. This area is often seen as a potential support level where the price might bounce back up, providing a good entry point for a long position.

Example: If you are bullish on the SPX500 and notice it is in an uptrend, you might wait for the price to dip towards the uptrend line. Once the price nears this trendline, you can consider entering a buy position, anticipating that the price will resume its upward movement.

Selling in a Downtrend

Conversely, in a downtrend, traders seek opportunities to sell when the price nears the downtrend line. This area is viewed as potential resistance, where the price may reverse back down, offering a good entry point for a short position.

Recognizing Breakouts

Trendlines also help traders identify potential breakout scenarios. When the price breaks through a trendline with significant volume, it may indicate a strong move in the direction of the breakout. Traders can use this signal to enter trades in the direction of the new trend. Breakouts can occur either above a downtrend line or below an uptrend line and are often accompanied by increased volatility.

Using Trendlines in Conjunction with Other Tools

While trendlines are powerful, they are most effective when used alongside other technical analysis tools. For example, combining trendlines with moving averages, Fibonacci retracements, or momentum indicators can provide a more comprehensive view of market conditions. This multi-tool approach helps confirm signals and reduce the likelihood of false breakouts or reversals.

Trendline Channels

Another advanced application of trendlines is the creation of trendline channels. By drawing a parallel line to an existing trendline, traders can form a channel that encapsulates price movements. These channels highlight both support and resistance zones, providing traders with a broader perspective on potential price ranges.

Types of Trendline Channels:

Ascending Channel

Formed by drawing a parallel line above an uptrend line. This channel indicates a strong bullish trend with defined resistance levels.

Descending Channel

Created by adding a parallel line below a downtrend line. This channel represents a bearish trend with clear support zones.

horizontal channel

Constructed by drawing two parallel lines around a sideways trend. This type of channel is useful for identifying consolidation periods and potential breakout opportunities.

common mistakes when using trendlines

forcing trendlines

Some traders attempt to force trendlines onto a chart, ignoring key price points. This can lead to inaccurate conclusions and poor trading decisions.

relying solely on trendlines

Trendlines should not be the only tool used for trading decisions. Failing to incorporate other technical or fundamental analyses can result in missed opportunities or unexpected losses.

ignoring volume

Volume plays a crucial role in confirming the validity of trendline breakouts. Overlooking this factor can lead to false signals and misinterpreted market movements.

Key Takeaways

Trendlines are invaluable for identifying the direction of market trends by connecting significant highs or lows.
There are three primary types of trendlines: uptrend, downtrend, and horizontal trendlines.
Drawing trendlines can be subjective, leading to varied interpretations among traders.
Trendlines help traders identify potential buy and sell zones by acting as support in uptrends and resistance in downtrends.
Breakouts through trendlines, especially with significant volume, can indicate strong moves in the market direction.
Combining trendlines with other technical analysis tools enhances accuracy and reduces the risk of false signals.
Practice proper risk management and avoid common mistakes to maximize the effectiveness of trendline trading.

Free Telegram

Join free telegram for analysis, trade ideas, & trading resources!

Join telegram

Related Videos

How to Trade Forex using Trendlines | Trendline Trading Strategy?
FREE Price Action Course: Mastering Trendlines for Pullbacks & Breakouts

Continue learning technical analysis:

Back to course home
  • Trendlines

    Learn how to draw and utilize trendlines in your technical analysis!
    How To Trade Forex Using Trendlines
    Mastering Trendlines For Pullbacks & Breakouts

    Start lesson

  • Moving Averages

    Learn all about moving averages, and how to trade with them!
    how to trade moving averages
    understanding price action

    Start lesson

  • Relative Strength Index

    Learn all RSI, and how to trade with it!
    How To Trade The RSI Profitably
    Relative Strength Index Example

    Start lesson

  • MACD Indicator

    Learn all about the MACD indicator, and how to trade with it!
    MACD example

    Start lesson

  • Candlestick Pattern Basics

    Learn all about candlestick patterns, how to spot them, and how to trade them!
    How to read candlesticks

    Start lesson

Home
Edgefinder
StockBox
Signals

LINDEX Company

LINDEX is a leading financial analysis and trading education company dedicated to empowering traders of all levels. Our team combines extensive market knowledge with cutting-edge technology to provide valuable insights and tools for traders worldwide.
2025 All Rights Reserved | LINDEX Company
Leveraged trading in foreign currency contracts or other off-exchange products on margin carries a high level of risk and is not suitable for everyone. You may lose more than you invest. Price and performance data is provided for informational purposes only and is not investment advice. Past performance is not indicative of future results.

There is a significant degree of risk involved in trading securities. With respect to foreign exchange trading, there is considerable risk exposure, including but not limited to, leverage, creditworthiness, limited regulatory protection and market volatility that may substantially affect the price, or liquidity of a currency or currency pair. CFDs are complex instruments and come with a high risk of losing money rapidly due to leverage. The vast majority of retail client accounts lose money when trading in CFDs. You should consider whether you can afford to take the high risk of losing your money.
homepushpinsmartphonelaptop-phonechart-barscrosscross-circle
linkedin facebook pinterest youtube rss twitter instagram facebook-blank rss-blank linkedin-blank pinterest youtube twitter instagram