40% Off Signals

Fibonacci Retracement Trading Strategy

technical Analysis Course
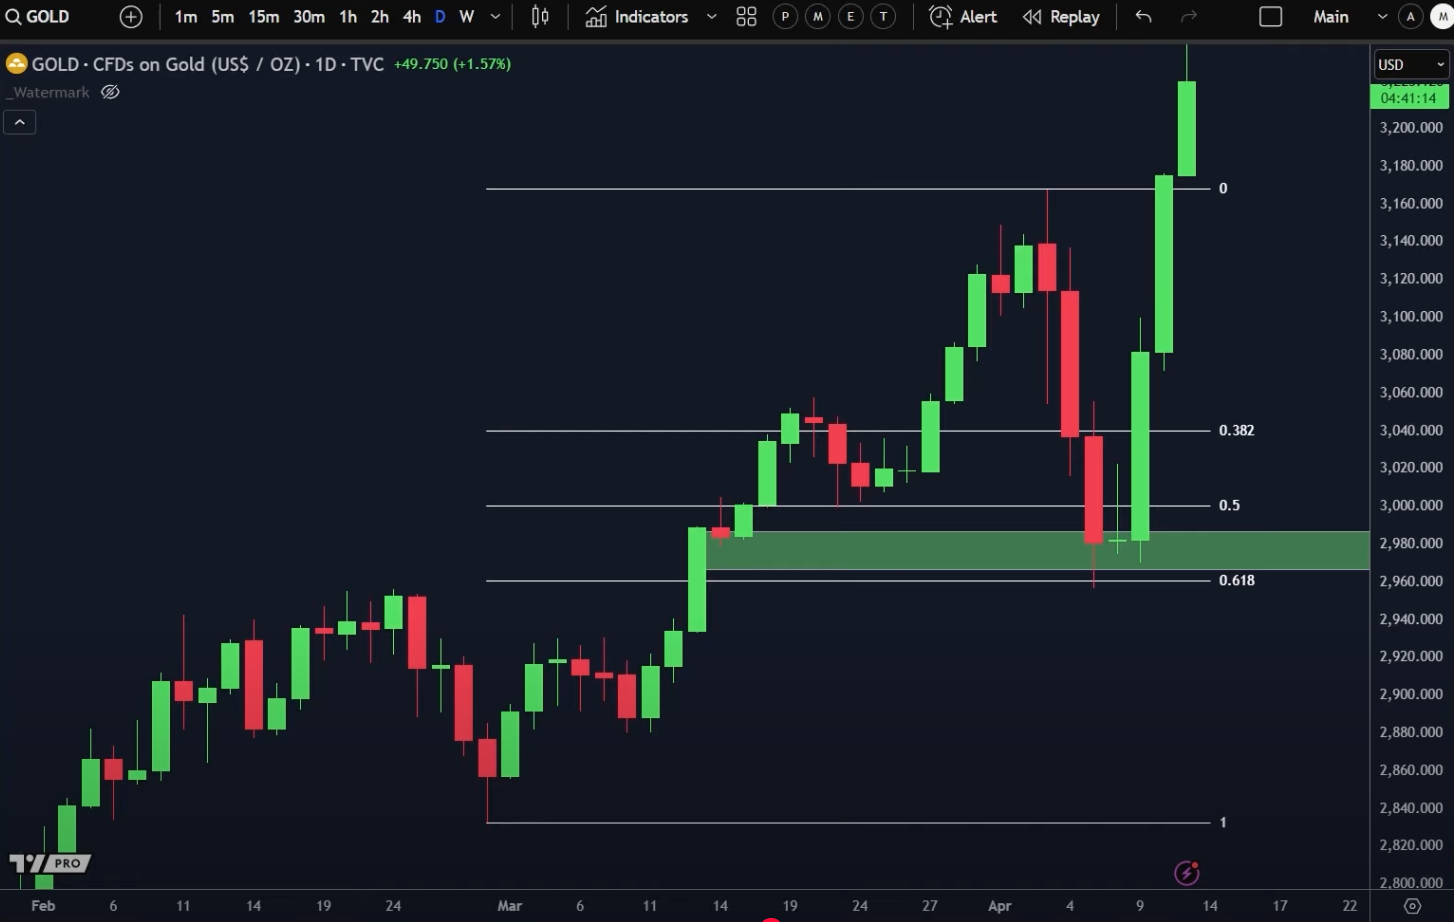
The Fibonacci retracement tool is a popular and powerful technique used by traders to identify potential levels where a market might retrace before continuing its dominant trend. Found on most charting platforms, including TradingView, it helps traders anticipate key areas for potential entries. Let's explore how this tool works and how you can use it in your trading.

Understanding Fibonacci Levels

When you apply the Fibonacci retracement tool to a chart, drawing it from the low to the high of a significant upward move (or high to low in a downtrend), it automatically plots horizontal lines at key Fibonacci ratios. The most commonly used levels are:
38.2%
50%
61.8%
Fibonacci Retracement Trading Strategy
These percentages represent potential areas of support (in an uptrend) or resistance (in a downtrend) where the price might pause or reverse slightly before continuing in the direction of the original trend.

How to Apply the Tool

1. Identify a Trend: The Fibonacci retracement tool is most effective in trending markets (either clearly upward or downward).

2. Draw the Retracement:
Uptrend: Click on the swing low of the move and drag the tool to the swing high.
Downtrend: Click on the swing high of the move and drag the tool to the swing low.

3. Observe the Levels: The tool will then display the Fibonacci retracement levels on your chart.

Interpreting the Levels

These Fibonacci levels are considered dynamic areas of potential support or resistance. Traders often watch to see if the price retraces to one of these levels and then shows signs of reversing in the direction of the primary trend.
Common Areas: Many traders pay close attention to the 50% and 61.8% retracement levels, as these are often seen as significant areas of potential reversal. However, the 38.2% level can also act as support or resistance, especially in strong trends.
Fibonacci Retracement zones

Fibonacci Retracement Zones

It's important to think of these Fibonacci levels not necessarily as exact points where a reversal will happen, but rather as potential zones of interest. For example, the area between the 50% and 61.8% Fibonacci levels can often act as a strong support or resistance zone.

The Importance of Context

While the Fibonacci retracement tool can be very useful, it's most powerful when used in conjunction with other forms of technical analysis. Consider these points:
Trend Strength: Use Fibonacci in clearly trending markets for the best results. It's less reliable in choppy, sideways price action.
Confluence: Look for Fibonacci levels that align with other key technical levels, such as established support and resistance areas. This "confluence" can increase the likelihood of a reaction at that level.
Additional Filters: Some traders use moving averages to help confirm the overall trend and potential reversal points at Fibonacci levels.

customization

Most charting platforms allow you to customize the Fibonacci levels displayed. While the 38.2%, 50%, and 61.8% are the most common, some traders also use levels like 23.6% (for shallow pullbacks in strong trends) or 78.6%. You can adjust these settings to match your trading style.
how to customize fibonacci retracement levels

Avoiding Common Pitfalls

Ignoring the Trend: Using Fibonacci in a non-trending market can lead to false signals.
Over-reliance on One Level: Avoid thinking that one specific Fibonacci level is always the "best." All of them can be significant depending on the context.

Key Takeaways

Fibonacci retracement levels help identify potential pullback zones within a trend.
The 38.2%, 50%, and 61.8% levels are the most commonly used by traders.
Use Fibonacci tools in clearly trending markets for more reliable signals.
Look for confluence with other technical indicators to strengthen your analysis.
Treat Fibonacci levels as zones of interest, not exact reversal points.

Free Telegram

Join free telegram for analysis, trade ideas, & trading resources!

Join telegram

Related Videos

The BEST Fibonacci Retracement Trading Strategy (Beginner Friendly)

Continue learning technical analysis:

Back to course home
  • Trendlines

    Learn how to draw and utilize trendlines in your technical analysis!
    How To Trade Forex Using Trendlines
    Mastering Trendlines For Pullbacks & Breakouts

    Start lesson

  • Moving Averages

    Learn all about moving averages, and how to trade with them!
    how to trade moving averages
    understanding price action

    Start lesson

  • Relative Strength Index

    Learn all RSI, and how to trade with it!
    How To Trade The RSI Profitably
    Relative Strength Index Example

    Start lesson

  • MACD Indicator

    Learn all about the MACD indicator, and how to trade with it!
    MACD example

    Start lesson

  • Candlestick Pattern Basics

    Learn all about candlestick patterns, how to spot them, and how to trade them!
    How to read candlesticks

    Start lesson

Home
Edgefinder
StockBox
Signals

LINDEX Company

LINDEX is a leading financial analysis and trading education company dedicated to empowering traders of all levels. Our team combines extensive market knowledge with cutting-edge technology to provide valuable insights and tools for traders worldwide.
2025 All Rights Reserved | LINDEX Company
Leveraged trading in foreign currency contracts or other off-exchange products on margin carries a high level of risk and is not suitable for everyone. You may lose more than you invest. Price and performance data is provided for informational purposes only and is not investment advice. Past performance is not indicative of future results.

There is a significant degree of risk involved in trading securities. With respect to foreign exchange trading, there is considerable risk exposure, including but not limited to, leverage, creditworthiness, limited regulatory protection and market volatility that may substantially affect the price, or liquidity of a currency or currency pair. CFDs are complex instruments and come with a high risk of losing money rapidly due to leverage. The vast majority of retail client accounts lose money when trading in CFDs. You should consider whether you can afford to take the high risk of losing your money.
homepushpinsmartphonelaptop-phonechart-barscross-circle
linkedin facebook pinterest youtube rss twitter instagram facebook-blank rss-blank linkedin-blank pinterest youtube twitter instagram