40% Off Signals

how to trade Support and Resistance

technical Analysis Course
Support and resistance are among the most fundamental concepts in technical analysis. These levels are widely used by traders and investors to make informed decisions about when to enter or exit trades. Despite their simplicity, support and resistance remain powerful tools for predicting potential price movements in various financial markets, including stocks, forex, and cryptocurrency. This guide will delve into the intricacies of support and resistance, explaining what they are, how to identify them, and how they can be effectively used in trading strategies.

What Are Support and Resistance?

Support and resistance levels are specific price points or zones on a chart where the price of an asset tends to reverse or consolidate. These levels are critical because they reflect the balance between supply and demand in the market.

Support

This refers to a price level where demand is strong enough to prevent the price from falling further. When the price of an asset approaches a support level, buyers typically step in, creating a "floor" that prevents further decline.

Resistance

Conversely, resistance is a price level where selling pressure outweighs buying pressure, preventing the price from rising further. It acts as a "ceiling" that the price struggles to break through.
Support and resistance levels are not just static lines on a chart; they can also appear as zones or ranges. These levels are crucial for identifying potential entry and exit points in a trade.

Understanding the Importance of Support and Resistance

Support and resistance levels are widely regarded as the number one price action tool for traders. Their importance lies in their ability to provide valuable insights into market sentiment and behavior:

1. Predicting price reversals

Support and resistance levels often indicate where the price is likely to reverse, helping traders anticipate future movements.

2. gauging market strength

These levels help traders assess whether the market is bullish, bearish, or consolidating.

3. setting entry and exit points

By identifying key levels, traders can strategically plan where to enter or exit trades.

4. risk mangagement

Support and resistance levels allow traders to place stop-loss and take-profit orders more effectively, minimizing risk.

The Basics of Support and Resistance

The concept of support and resistance revolves around the principles of supply and demand. Here’s how these levels function:

Support Levels

These levels indicate areas of demand. When the price approaches a support level, buyers typically enter the market, creating upward pressure on the price.

Resistance levels

These levels indicate areas of supply. When the price approaches a resistance level, sellers typically enter the market, creating downward pressure on the price.
The interaction between these levels and the market’s supply and demand dynamics can create patterns that traders use to make informed decisions.

How to Identify Support and Resistance

Identifying support and resistance levels requires analyzing historical price data and understanding market psychology. Here are some common methods to locate these levels:

1. using historical data

Historical price data is one of the most reliable ways to identify support and resistance levels. Look for areas on the chart where the price has reversed or consolidated multiple times. These levels often indicate significant support or resistance zones.

2. Looking for Pivot Points

One of the simplest ways to identify support and resistance is by spotting "V" shapes (support) and inverted "V" shapes (resistance) on a chart. These pivot points often signal areas where the price is likely to change direction.

3. Round Numbers

Round numbers, such as $50, $100, or $1,000, often act as psychological support or resistance levels. Traders tend to place buy or sell orders around these levels, making them significant.

4. trendlines

Drawing trendlines is another effective method for identifying dynamic support and resistance levels. These lines connect a series of highs or lows, showing the overall direction of the market while also highlighting key levels.

5. moving averages

Moving averages, such as the 50-day or 200-day moving averages, can act as dynamic support and resistance levels. When the price approaches these averages, it often reverses or consolidates.

Support Zones vs. Resistance Levels

Support Zones

Support zones are areas on a chart that act as a "floor," preventing the price from falling further. These zones are created by increased buying activity, indicating strong demand. For example, if a stock consistently bounces back when it reaches $50, this price level becomes a support zone.

Key characteristics of support zones:

Indicate strong buyer interest.
Serve as potential entry points for long positions.
If broken, can turn into resistance levels.

Resistance Levels

Resistance levels are the opposite of support zones. They act as a "ceiling," preventing the price from rising further. These levels are created by increased selling activity, indicating strong supply. For example, if a stock struggles to break above $100, this price level becomes a resistance level.

Key characteristics of resistance levels:

Indicate strong seller interest.
Serve as potential entry points for short positions.
If broken, can turn into support levels.

Why Support and Resistance Work

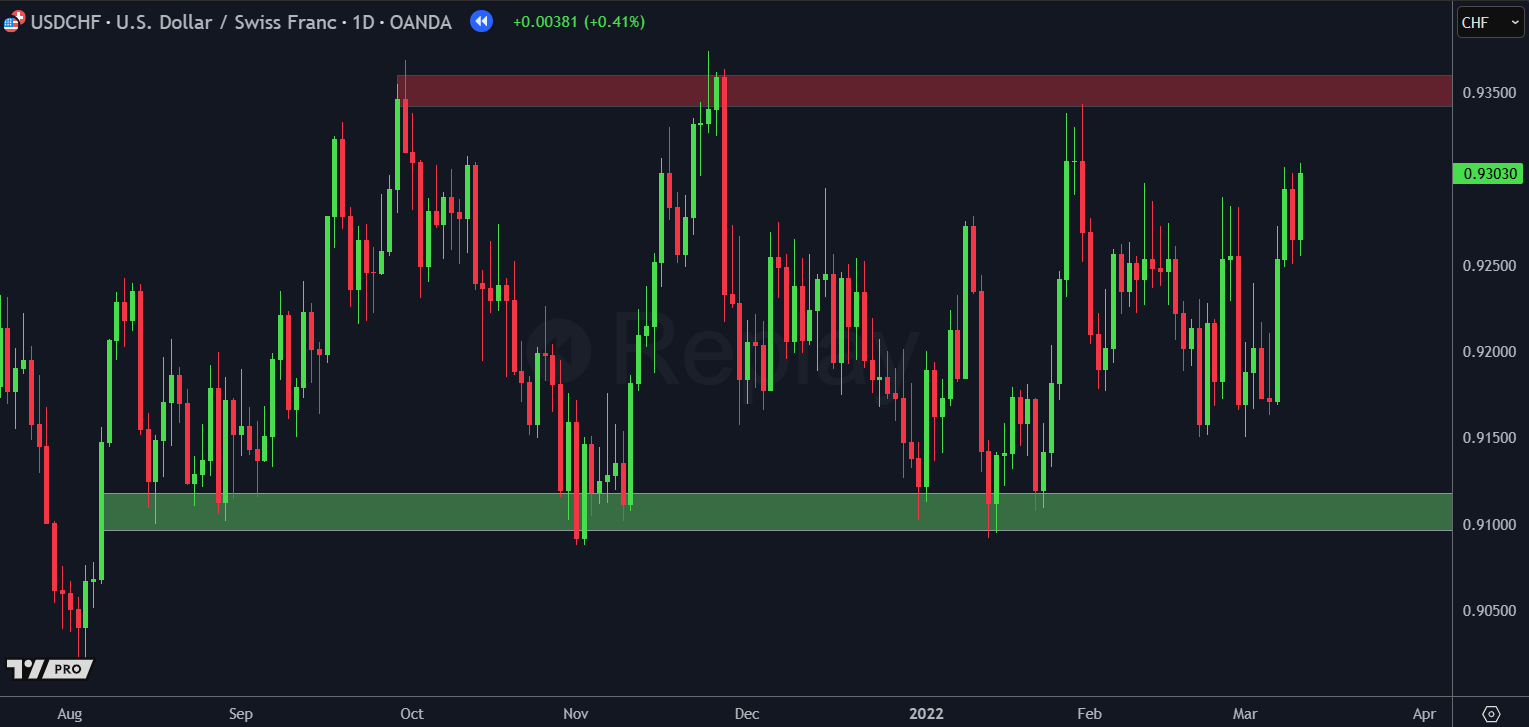
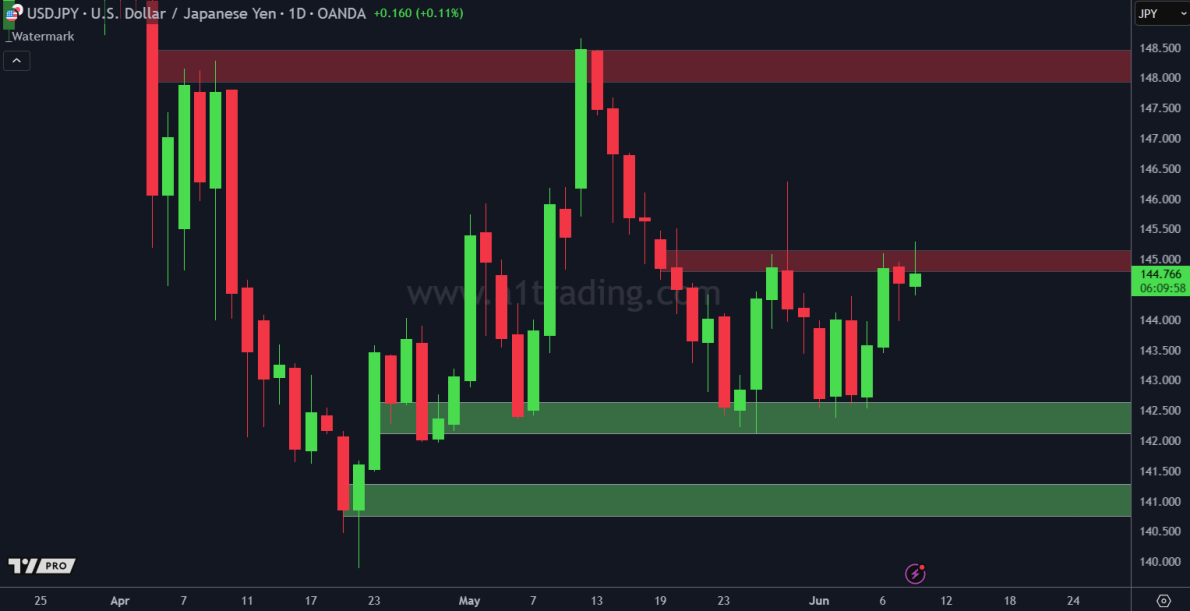
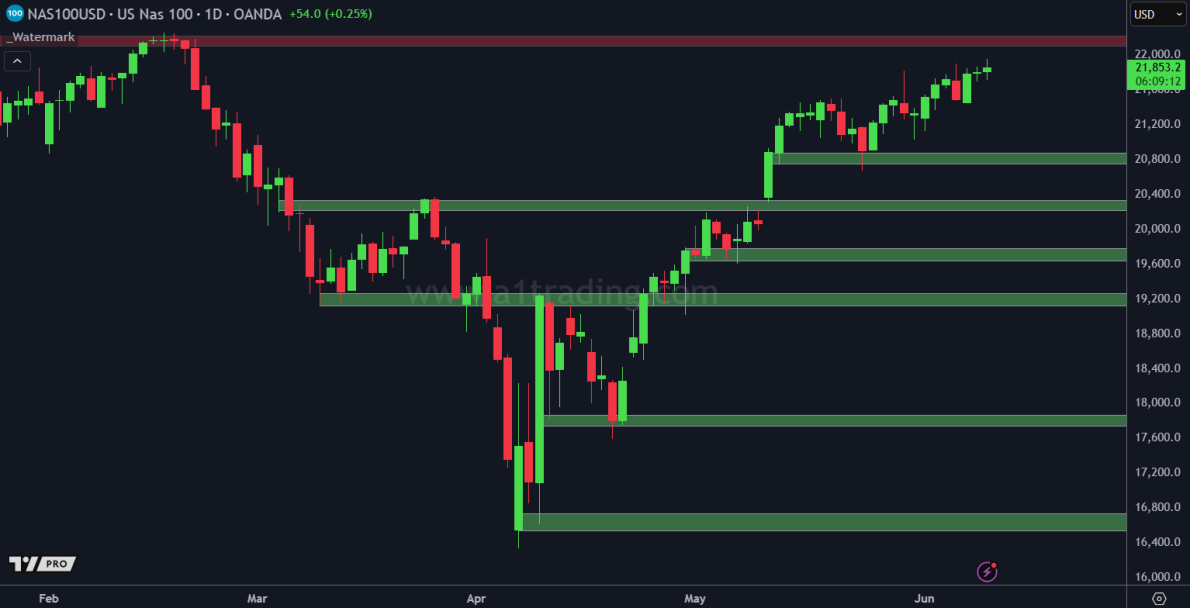
Support and resistance levels are effective because they reflect market psychology. Traders and investors tend to react predictably to certain price levels, creating patterns that can be analyzed and used for strategic trading.

For instance:
- When the price approaches a support level, traders expect it to bounce back, leading to increased buying activity.
- When the price approaches a resistance level, traders expect it to pull back, leading to increased selling activity.

This collective behavior reinforces the significance of these levels, making them reliable tools for technical analysis.

How to Use Support and Resistance in Trading

1. Planning Entries and Exits

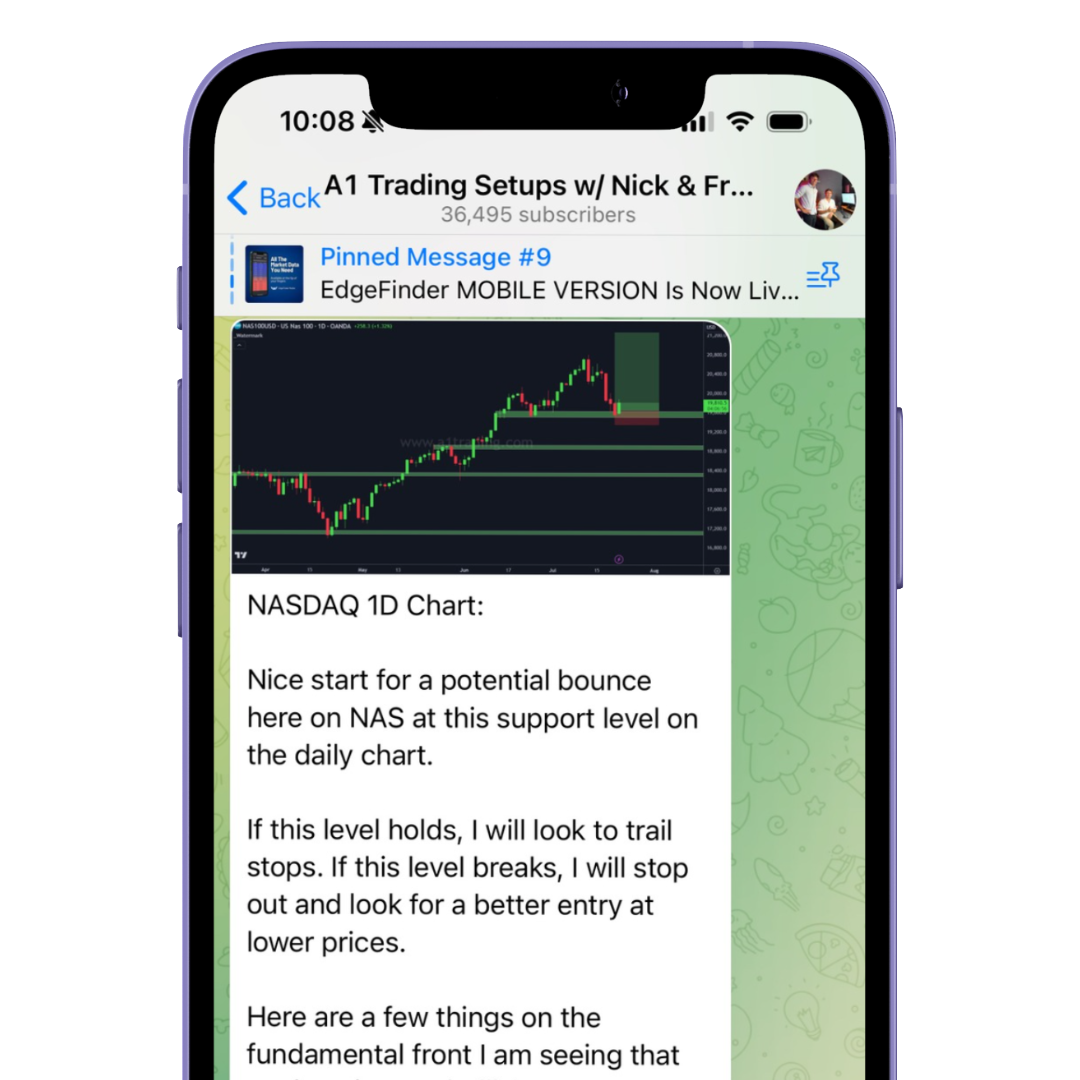
Support and resistance levels are ideal for planning trade entries and exits. 

For example:
- Buy near support levels and sell near resistance levels in a ranging market.
- Wait for a breakout above resistance or below support in a trending market

2. Breakouts and Pullbacks

Breakouts occur when the price moves beyond a support or resistance level. This can signal the start of a new trend. Traders often wait for a pullback to the broken level to confirm the breakout before entering a trade.

3. Combining with Other Indicators

Support and resistance levels are more effective when used with other technical indicators, such as moving averages, RSI, or MACD. These tools can provide additional confirmation for trade setups.

Limitations of Support and Resistance

While support and resistance are valuable tools, they are not foolproof. Here are some limitations to keep in mind:
False Breakouts: Sometimes, the price may temporarily break through a level before reversing, leading to false signals.
Subjectivity: Identifying support and resistance levels can be subjective, as traders may interpret charts differently.
Market Conditions: In highly volatile markets, support and resistance levels may become less reliable.
To mitigate these limitations, it is essential to use support and resistance in conjunction with other tools and strategies.

Key Takeaways

Support levels act as areas of demand where buyers step in to prevent the price from falling further.
Resistance levels act as areas of supply where sellers step in to prevent the price from rising further.
Support and resistance are among the most commonly used tools in technical analysis.
These levels are not perfect, but they provide valuable insights for identifying trade opportunities.
Practice risk management to protect your account and minimize losses

Free Telegram

Join free telegram for analysis, trade ideas, & trading resources!

Join telegram

Related Videos

FREE Price Action Course: Mastering Support & Resistance in Forex
How to Trade Support & Resistance: Secrets Revealed! ?

Continue learning technical analysis:

Back to course home
  • Trendlines

    Learn how to draw and utilize trendlines in your technical analysis!
    How To Trade Forex Using Trendlines
    Mastering Trendlines For Pullbacks & Breakouts

    Start lesson

  • Moving Averages

    Learn all about moving averages, and how to trade with them!
    how to trade moving averages
    understanding price action

    Start lesson

  • Relative Strength Index

    Learn all RSI, and how to trade with it!
    How To Trade The RSI Profitably
    Relative Strength Index Example

    Start lesson

  • MACD Indicator

    Learn all about the MACD indicator, and how to trade with it!
    MACD example

    Start lesson

  • Candlestick Pattern Basics

    Learn all about candlestick patterns, how to spot them, and how to trade them!
    How to read candlesticks

    Start lesson

Home
Edgefinder
StockBox
Signals

LINDEX Company

LINDEX is a leading financial analysis and trading education company dedicated to empowering traders of all levels. Our team combines extensive market knowledge with cutting-edge technology to provide valuable insights and tools for traders worldwide.
2025 All Rights Reserved | LINDEX Company
Leveraged trading in foreign currency contracts or other off-exchange products on margin carries a high level of risk and is not suitable for everyone. You may lose more than you invest. Price and performance data is provided for informational purposes only and is not investment advice. Past performance is not indicative of future results.

There is a significant degree of risk involved in trading securities. With respect to foreign exchange trading, there is considerable risk exposure, including but not limited to, leverage, creditworthiness, limited regulatory protection and market volatility that may substantially affect the price, or liquidity of a currency or currency pair. CFDs are complex instruments and come with a high risk of losing money rapidly due to leverage. The vast majority of retail client accounts lose money when trading in CFDs. You should consider whether you can afford to take the high risk of losing your money.
homepushpinsmartphonelaptop-phonepie-chartchart-barsbriefcasecross-circle
linkedin facebook pinterest youtube rss twitter instagram facebook-blank rss-blank linkedin-blank pinterest youtube twitter instagram