40% Off Signals

Relative Strength Index

technical Analysis Course
The Relative Strength Index (RSI) is a widely-used technical analysis tool designed to help traders evaluate whether a financial instrument is overbought or oversold. Operating on a scale from 1 to 100, the RSI provides critical insights into market sentiment and price momentum. Readings below 30 indicate an oversold condition, while readings above 70 suggest an overbought condition. By assessing the current price in relation to the average of previous prices over a specific time frame, RSI becomes a vital component in making informed buy or sell decisions.

how RSI works

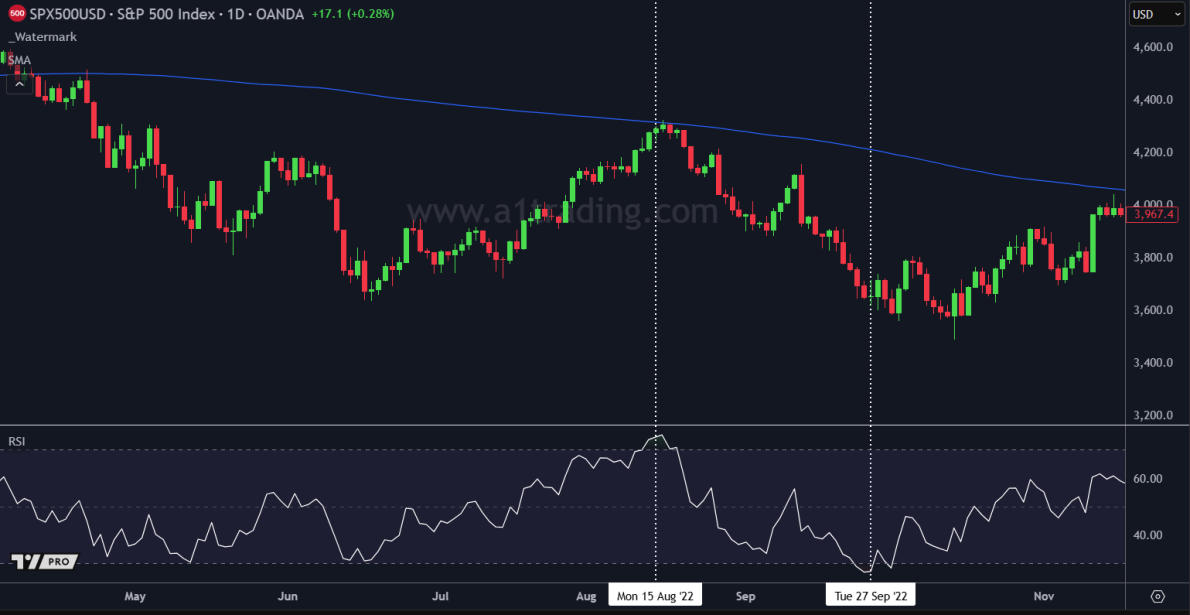
RSI is calculated by analyzing the average gain and average loss over a specific period, most commonly set at 14 days. This calculation places the current price on a scale from 1 to 100. For example, a 14-day RSI measures the strength or weakness of the price movements within those 14 days.

This scale helps traders:
Identify potential turning points in the market.
Gauge whether a price trend is sustainable or due for a reversal.

Interpretation of RSI Levels

Below 30 (Oversold)

When RSI dips to 30 or below, it indicates that the asset might be undervalued. This often signals a buying opportunity as the price could be poised for a rebound. For instance, traders might look for bullish confirmation before entering long positions in this scenario.

Above 70 (Overbought)

An RSI reading of 70 or above suggests the asset might be overvalued. This is often a signal for traders to consider selling, as the price might be due for a correction. However, overbought conditions can sometimes persist, so additional analysis is recommended before taking action.
RSI example Relative strength index

Practical Applications of RSI

RSI is particularly effective for identifying potential "buy-the-dip" or "short-the-top" opportunities. However, as shown in the CADJPY example, RSI alone is not always sufficient. The indicator works best when used as part of a comprehensive trading strategy that includes:
Other technical indicators (e.g., moving averages, MACD).
Fundamental analysis to confirm market sentiment.
Risk management techniques to mitigate losses.
RSI is particularly effective for identifying potential "buy-the-dip" or "short-the-top" opportunities. However, as shown in the CADJPY example, RSI alone is not always sufficient. The indicator works best when used as part of a comprehensive trading strategy that includes:

Key Takeaways

RSI measures whether an asset is overbought or oversold on a scale of 1 to 100.
Readings below 30 suggest oversold conditions, while readings above 70 indicate overbought conditions.
RSI is most effective when combined with other technical indicators and market analysis.
The indicator helps identify potential buying and selling opportunities but should not be relied upon in isolation.
The Relative Strength Index is a powerful tool that belongs in every trader’s toolkit. By understanding how it works and using it alongside other analytical methods, traders can gain valuable insights into market conditions and make more informed decisions.

Free Telegram

Join free telegram for analysis, trade ideas, & trading resources!

Join telegram

Related Videos

How to Trade the RSI Profitably! Trading the Relative Strength Index ??

Continue learning technical analysis:

Back to course home
  • Trendlines

    Learn how to draw and utilize trendlines in your technical analysis!
    How To Trade Forex Using Trendlines
    Mastering Trendlines For Pullbacks & Breakouts

    Start lesson

  • Moving Averages

    Learn all about moving averages, and how to trade with them!
    how to trade moving averages
    understanding price action

    Start lesson

  • Relative Strength Index

    Learn all RSI, and how to trade with it!
    How To Trade The RSI Profitably
    Relative Strength Index Example

    Start lesson

  • MACD Indicator

    Learn all about the MACD indicator, and how to trade with it!
    MACD example

    Start lesson

  • Candlestick Pattern Basics

    Learn all about candlestick patterns, how to spot them, and how to trade them!
    How to read candlesticks

    Start lesson

Home
Edgefinder
StockBox
Signals

LINDEX Company

LINDEX is a leading financial analysis and trading education company dedicated to empowering traders of all levels. Our team combines extensive market knowledge with cutting-edge technology to provide valuable insights and tools for traders worldwide.
2025 All Rights Reserved | LINDEX Company
Leveraged trading in foreign currency contracts or other off-exchange products on margin carries a high level of risk and is not suitable for everyone. You may lose more than you invest. Price and performance data is provided for informational purposes only and is not investment advice. Past performance is not indicative of future results.

There is a significant degree of risk involved in trading securities. With respect to foreign exchange trading, there is considerable risk exposure, including but not limited to, leverage, creditworthiness, limited regulatory protection and market volatility that may substantially affect the price, or liquidity of a currency or currency pair. CFDs are complex instruments and come with a high risk of losing money rapidly due to leverage. The vast majority of retail client accounts lose money when trading in CFDs. You should consider whether you can afford to take the high risk of losing your money.
homesmartphonelaptop-phonechart-barscross-circle
linkedin facebook pinterest youtube rss twitter instagram facebook-blank rss-blank linkedin-blank pinterest youtube twitter instagram