40% Off Signals

Moving Averages in Trading

technical Analysis Course
Moving averages are one of the most popular tools in technical analysis, frequently used by traders to identify trends, support and resistance levels, and potential trading opportunities. At their core, moving averages are essentially a collection of data points representing past prices. By calculating the average of these points over a specified time frame, moving averages aim to smooth out price fluctuations and suggest the general direction of price action.

Moving averages are a versatile tool that can be applied in various market conditions. They act as dynamic indicators of market trends, allowing traders to interpret whether the market sentiment is bullish (positive) or bearish (negative). Additionally, moving averages often play a role in identifying potential support or resistance levels—zones where prices are more likely to reverse or stall. A break above a moving average can signal continued buying interest, while a break below it might indicate sustained selling pressure.

Types of Moving Averages

In trading, there are three primary types of moving averages, each with unique characteristics and applications:

1. Simple Moving Averages (sMA):

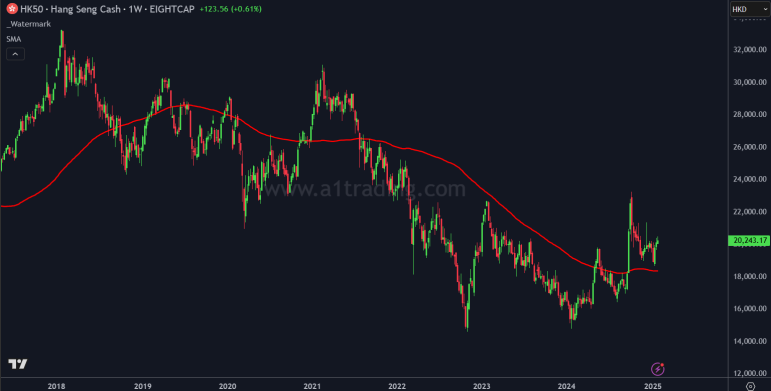
The Simple Moving Average is the most basic form of moving average and is calculated by taking the unweighted mean of the previous data points. For instance, if you're calculating a 10-day SMA, you add the closing prices of the last 10 days and divide by 10. This provides a straightforward average that updates daily, giving traders a sense of the average price over a specified period.

While the SMA is easy to calculate and understand, it has its limitations. Because it assigns equal weight to all data points, it may lag behind current price action, especially during periods of rapid market changes. Despite this, the SMA remains a valuable tool for identifying long-term trends and is often used in combination with other indicators to enhance its effectiveness.

2. Cumulative Moving Average (CMA):

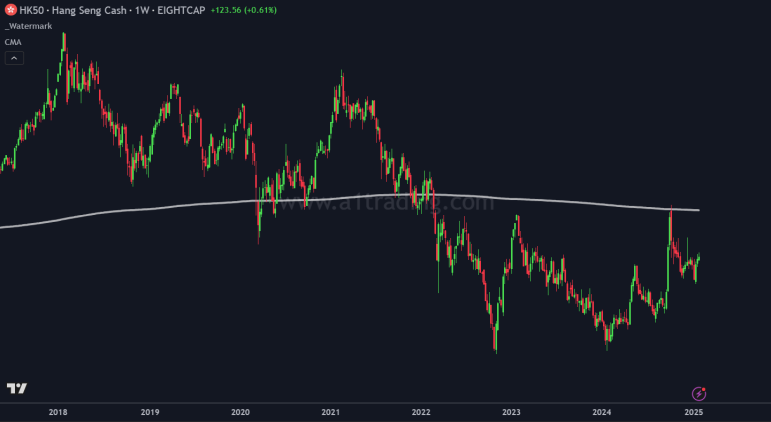
The Cumulative Moving Average takes a different approach by considering all data points from the beginning of the dataset. It updates its calculation as new data becomes available, meaning it provides a continually adjusted average that reflects the entire price history up to the present moment.

The CMA is particularly useful for analyzing data over extended periods, as it incorporates the full range of historical information into its calculations. However, its reliance on a large dataset means it may not react as quickly to short-term price changes, making it less suitable for traders focused on immediate trends or short-term opportunities.

3. Weighted Moving Average (WMA):

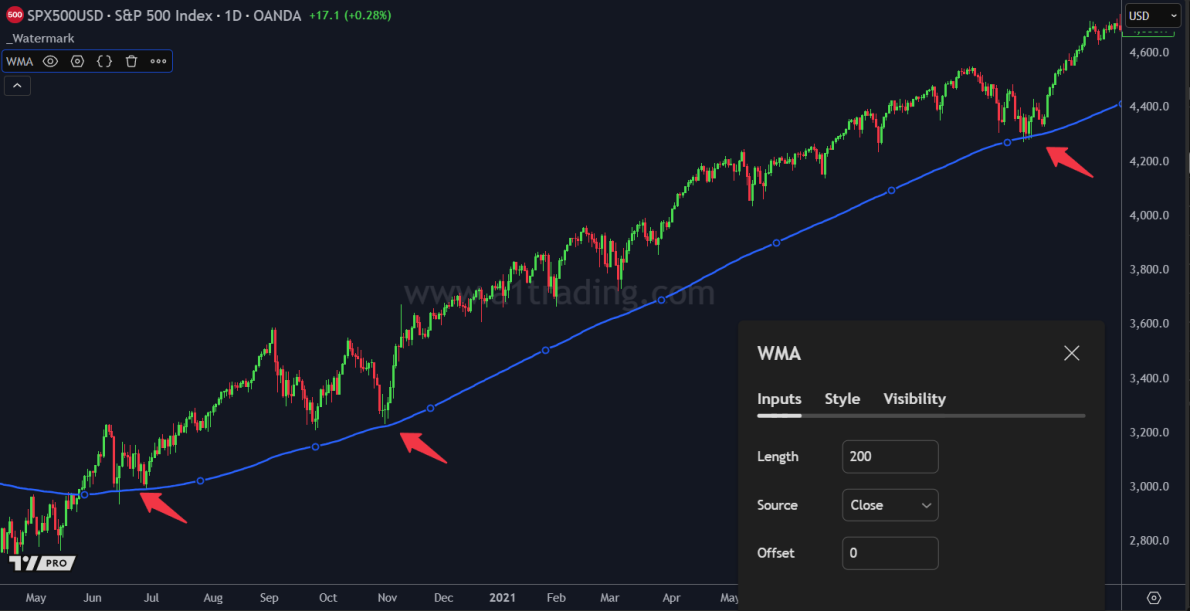
Unlike the SMA, the Weighted Moving Average assigns greater significance to more recent data points. This is achieved by multiplying each data point by a specific weight before calculating the average. As a result, the WMA responds more quickly to recent price changes, making it a popular choice for traders seeking to capture short-term market movements.

For example, in a 10-day WMA, the most recent day might be assigned a weight of 10, the previous day a weight of 9, and so on, with earlier days receiving progressively smaller weights. This weighting system ensures that the moving average remains more closely aligned with current price trends, providing traders with a clearer picture of recent market sentiment.
weighted moving average (wma) understanding moving averages in technical analysis
Traders often choose the type of moving average to use based on the specific data they wish to analyze and their overall trading strategy. Whether they prioritize long-term trends, historical data, or short-term market dynamics, moving averages offer a flexible and customizable approach to understanding price action.

How Moving Averages Are Used in Trading Strategies

Moving averages are employed in a variety of trading strategies, with two of the most common being trend following and mean reversion. Each of these approaches leverages the unique properties of moving averages to help traders identify potential entry and exit points in the market.

Trend Following

The trend-following strategy is based on the idea that "the trend is your friend." Traders using this approach aim to align their positions with the prevailing market direction, whether it’s upward (bullish) or downward (bearish).

Moving averages play a central role in trend-following strategies by providing a visual representation of the trend.
A rising moving average suggests an uptrend, encouraging traders to look for buying opportunities.
A declining moving average indicates a downtrend, prompting traders to consider selling opportunities.
One common technique is the use of moving average crossovers. This occurs when a shorter-term moving average (e.g., 10-day SMA) crosses above or below a longer-term moving average (e.g., 50-day SMA):
A bullish crossover (shorter-term moving average crosses above the longer-term moving average) may signal a buying opportunity.
A bearish crossover (shorter-term moving average crosses below the longer-term moving average) can indicate a selling opportunity.

Mean Reversion

The mean reversion strategy operates on the assumption that prices tend to revert to their historical averages over time. In this context, moving averages serve as benchmarks for identifying when prices have deviated too far from their "normal" levels.

Think of price action as a rubber band, with the moving average representing the center. When the price stretches too far in either direction—moving significantly above or below the average—it creates a stronger pull back toward the mean. Traders employing a mean reversion strategy use these deviations as potential entry or exit points, betting that prices will eventually return to the moving average.

Understanding Price Action Through Moving Averages

Price action refers to the movement of an asset's price over time and serves as the foundation of technical analysis. Moving averages help traders make sense of price action by smoothing out short-term fluctuations and highlighting the overall trend.

For instance, when prices are consistently trading above a moving average, it suggests bullish momentum, while prices below the moving average indicate bearish momentum. Furthermore, moving averages can act as dynamic support or resistance levels, where prices often pause or reverse.

It’s important to note that while moving averages are a powerful tool, they are not foolproof. Markets are influenced by a wide range of factors, and no indicator can predict future price movements with 100% accuracy. However, moving averages provide traders with a valuable framework for analyzing price action and making informed decisions.

Key Benefits of Moving Averages

1. trend identification

Moving averages help traders determine the direction of the market, making it easier to identify bullish or bearish trends.

2. Dynamic Support and Resistance

Unlike static levels, moving averages adjust to price changes, providing more relevant support and resistance levels.

3. versatility

Moving averages can be customized to suit different time frames, strategies, and trading styles.

4. Combination with Other Indicators:

Moving averages work well with other technical tools, such as RSI, MACD, and Bollinger Bands, to enhance trading strategies.

Limitations of Moving Averages

While moving averages are incredibly useful, they have their limitations:

Lagging Nature

Moving averages rely on historical data, which means they may lag behind current price action, especially in fast-moving markets.

Whipsaws in Range-Bound Markets

During periods of low volatility or sideways price movement, moving averages can generate false signals, leading to potential losses.

Dependence on Time Frame

The effectiveness of a moving average depends on the chosen time frame, requiring traders to experiment and adjust their settings.

Key Takeaways

Moving averages are collections of past price data points averaged to indicate general price trends.
There are three main types of moving averages: Simple Moving Average (SMA), Cumulative Moving Average (CMA), and Weighted Moving Average (WMA).
Traders use moving averages to identify support and resistance levels and to signal potential buying or selling opportunities.
Moving averages are essential in both trend-following and mean reversion strategies, offering a flexible approach to market analysis.
While not perfect, moving averages provide valuable insights into price action, helping traders determine whether to adopt a bullish or bearish position in the short or long term.

Free Telegram

Join free telegram for analysis, trade ideas, & trading resources!

Join telegram

Related Videos

how to trade moving averages

Continue learning technical analysis:

Back to course home
  • Trendlines

    Learn how to draw and utilize trendlines in your technical analysis!
    How To Trade Forex Using Trendlines
    Mastering Trendlines For Pullbacks & Breakouts

    Start lesson

  • Moving Averages

    Learn all about moving averages, and how to trade with them!
    how to trade moving averages
    understanding price action

    Start lesson

  • Relative Strength Index

    Learn all RSI, and how to trade with it!
    How To Trade The RSI Profitably
    Relative Strength Index Example

    Start lesson

  • MACD Indicator

    Learn all about the MACD indicator, and how to trade with it!
    MACD example

    Start lesson

  • Candlestick Pattern Basics

    Learn all about candlestick patterns, how to spot them, and how to trade them!
    How to read candlesticks

    Start lesson

Home
Edgefinder
StockBox
Signals

LINDEX Company

LINDEX is a leading financial analysis and trading education company dedicated to empowering traders of all levels. Our team combines extensive market knowledge with cutting-edge technology to provide valuable insights and tools for traders worldwide.
2025 All Rights Reserved | LINDEX Company
Leveraged trading in foreign currency contracts or other off-exchange products on margin carries a high level of risk and is not suitable for everyone. You may lose more than you invest. Price and performance data is provided for informational purposes only and is not investment advice. Past performance is not indicative of future results.

There is a significant degree of risk involved in trading securities. With respect to foreign exchange trading, there is considerable risk exposure, including but not limited to, leverage, creditworthiness, limited regulatory protection and market volatility that may substantially affect the price, or liquidity of a currency or currency pair. CFDs are complex instruments and come with a high risk of losing money rapidly due to leverage. The vast majority of retail client accounts lose money when trading in CFDs. You should consider whether you can afford to take the high risk of losing your money.
homedatabasepushpinmapsmartphonelaptop-phonepie-chartchart-barscrossmenu-circlecross-circle
linkedin facebook pinterest youtube rss twitter instagram facebook-blank rss-blank linkedin-blank pinterest youtube twitter instagram